library(shinydataviewer)
library(shiny)
library(bslib)
#>
#> Attaching package: 'bslib'
#> The following object is masked from 'package:utils':
#>
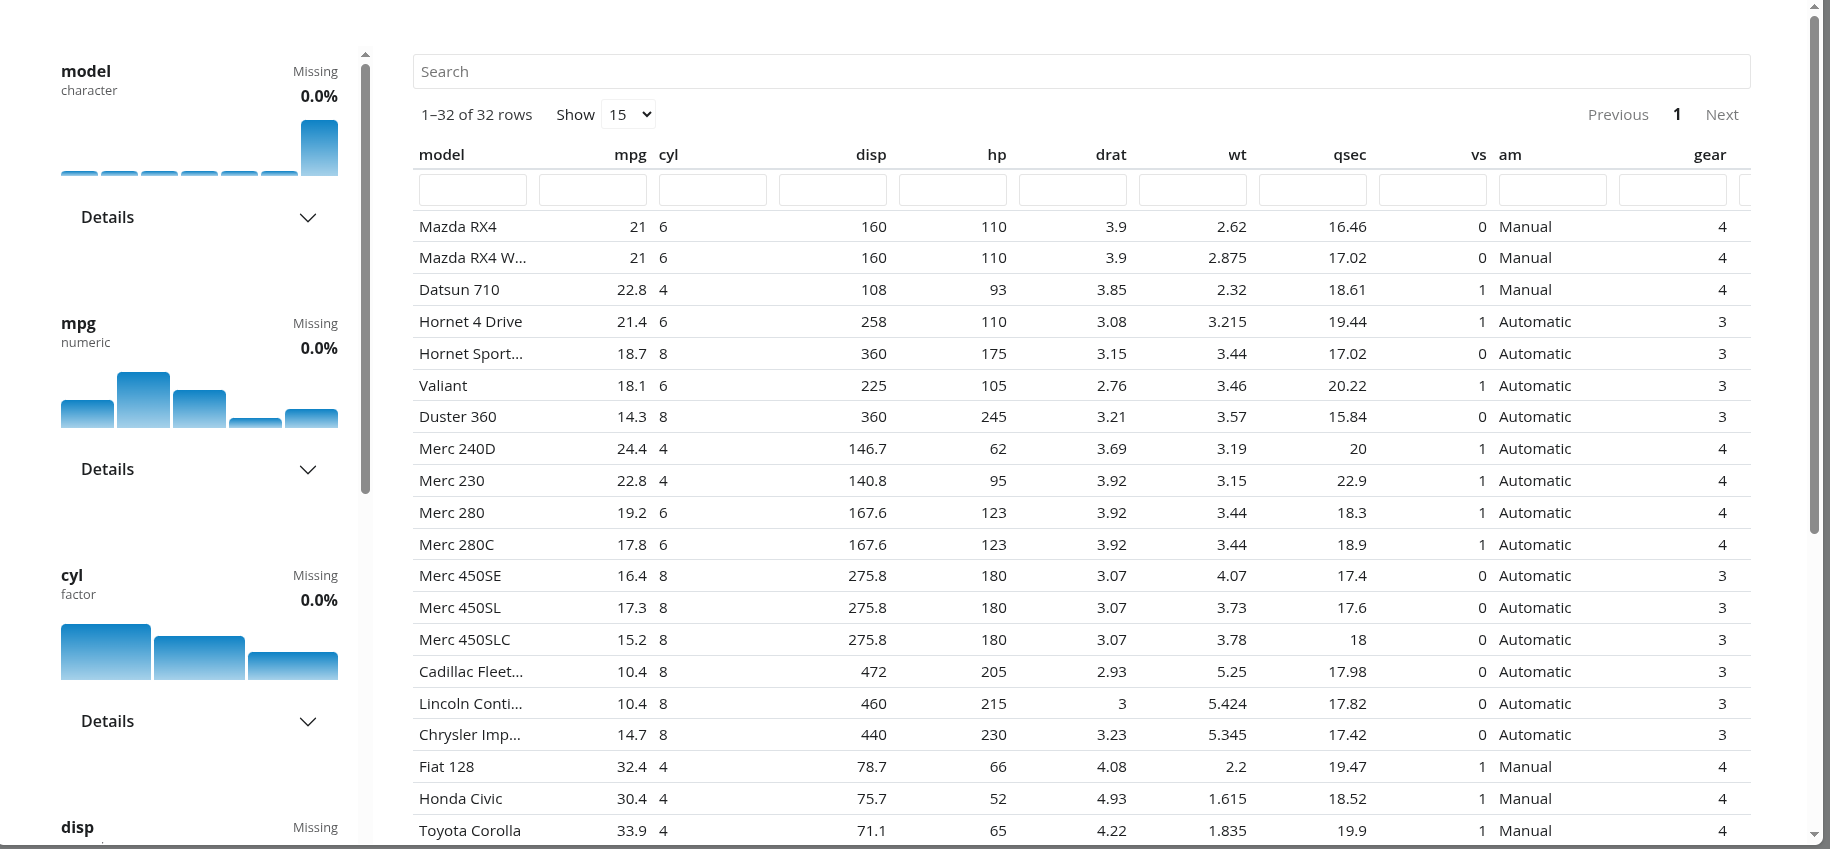
#> pageshinydataviewer provides a reusable Shiny module for
viewing data with:
- a
reactabledata viewer - a variable summary sidebar
- Bootstrap 5 compatible styling via
bslib
The module supports data frames with numeric, integer, character,
factor, logical, Date, and
POSIXct/POSIXt columns. Non-finite numeric
values such as Inf, -Inf, and NaN
are excluded from numeric summary statistics and histogram bins.
Minimal module
Use data_viewer_ui() when the viewer should manage its
own table card.
ui <- page_fillable(
  theme = bs_theme(version = 5),
  data_viewer_ui("viewer")
)

server <- function(input, output, session) {
  data_viewer_server(
    "viewer",
    data = reactive(iris)
  )
}

shinyApp(ui, server)
Embedded card
Use data_viewer_card_ui() when the viewer belongs inside
another layout.
ui <- page_fillable(
  theme = bs_theme(version = 5),
  layout_columns(
    col_widths = c(4, 8),
    card(
      card_header("Context"),
      card_body("Supporting content")
    ),
    data_viewer_card_ui(
      "viewer",
      title = "Dataset",
      full_screen = FALSE
    )
  )
)

server <- function(input, output, session) {
  data_viewer_server(
    "viewer",
    data = reactive(mtcars)
  )
}

shinyApp(ui, server)
Summary helper
The variable sidebar is backed by
summarize_columns().
summary_df <- summarize_columns(head(iris), top_n = 4)

summary_df[c("var_name", "type", "n_missing", "n_unique")]
#>                  var_name    type n_missing n_unique
#> Sepal.Length Sepal.Length numeric         0        6
#> Sepal.Width   Sepal.Width numeric         0        6
#> Petal.Length Petal.Length numeric         0        4
#> Petal.Width   Petal.Width numeric         0        2
#> Species           Species  factor         0        1
summarize_columns() returns one row per input column.
Its summary_stats and distribution_data
list-columns contain the precomputed payloads used by the viewer cards,
including detail statistics, categorical top-level counts, and compact
histogram metadata.